
Prometeia Atlante
Insight for your business

Giacomo Cotignano, Andrea Dossena, Maria Sara Pichierri
The idea that the prosperity of a nation derives from its ability to develop increasingly complex and innovative products, guaranteeing lasting competitive advantages is as old as the first economic theories following the advent of the industrial revolution (from Adam Smith on, so to speak).
Much less established, however, is what should be understood by complexity and, above all, how to measure it. The vast sample of complexity indicators developed could be broadly divided into two large categories: measures of product complexity (often defined a priori, so that a computer is fairly normally considered more complex than a package of pasta) or, on the other side, individual countries’ complexity (schooling, R & D expenses, patents, even in this case defined a priori). One of the few indicators able to overcome the limits of those proposed so far (a priori definitions of complexity and "unidirectionality" of the analysis, from products to countries or vice versa) has been developed since the early years of this decade by Harvard's Center for International Development and is known as the Economic Complexity Index (ECI).
The ECI, calculated on export data, is defined on the basis of related and recursive definitions of countries and products’ complexity. The more a country’s export basket is characterized by a large variety of products (diversity) that are simultaneously exported from other countries with high complexity, the more the country is complex. On the other side, a product complexity is a function of the number of countries specialized in its export (ubiquity), and of these countries export mix’s complexity.
To simplify, the calculation starts assessing for each product exported from a country, which other countries export it and what is their mix of exported products; for each product of this mix, will be checked which other countries export it and so on. Algebraically, it is equivalent to solving a system of matrix transformations in which the starting matrix consists of exporting countries and individual products, with entries of 1 if the country has a competitive advantage in the export of that product and 0 otherwise. This matrix is subsequently multiplied by the vector containing the number of each country’s specializations (diversity calculation) and by the vector of all countries specialized for each product (ubiquity calculation). The country (product) complexity indicator consists in the vector obtained by repeating the matrix operations until the ranking of the vector’s components (i.e. the individual indicators of complexity of the countries / products) no longer changes compared to the previous step.
The results allow highlighting those economies that, thanks to their complexity, possess significant competitive advantage and, consequently, better prospects of resilience and potential development. At the product level, the results point out the different content of capabilities embedded in them and, in fact, the ease with which they can be exported from the various countries based on their stage of maturation.
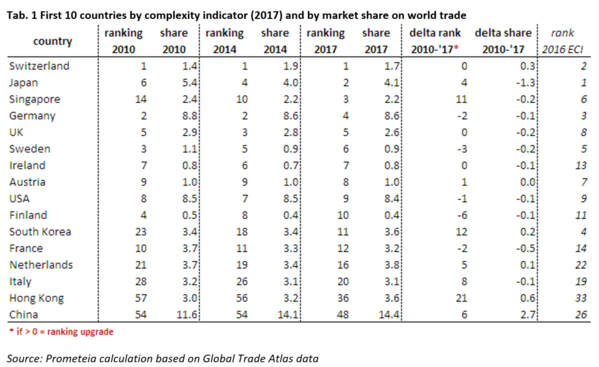
Following the methodology developed by Harvard's Center for International Development, we calculated the ECI ranking for the major world economies (based on international trade data on the fourth digit of the Harmonized System classification, for the years 2010, 2014 and 2017) and associated these rankings to the market shares of individual countries.
In order to avoid the risk of reporting as specialized those countries that achieve high export values in a given product due to re-export activity (eventuality not captured by the normal specialization indexes, such as the rca), we adopted a more stringent definition of specialization (rcap). We considered as comparative advantages only those cases in which the export specialization is matched by a positive commercial balance in that product. Furthermore, in order to reduce the "background noise" deriving from the scarcely significant global trade data, the countries that do not reach 20 billion of exports (i.e. with market shares below 0.06%, in 2017) and the products with global trade value smaller than one billion dollars have been eliminated. The effective db is thus made up of 70 countries and over 1200 HS codes at the fourth digit.
The results obtained are very similar to those of the ECI (whose last available year is 2016). In particular, the very first positions are characterized by deeply different countries both in terms of size and market shares (in level and in dynamics), but within common levels of average wealth and in the first places for the more traditional rankings related to innovative capacity, market efficiency and competitiveness of the respective economic systems.
As for Italy, the value confirms the gap often attributed to the country in terms of industrial complexity and production specialization, but also highlights one of the strongest improvements (the fourth, in the countries reported here) over the last few years. This advance signals the progressive upgrading of Italian manufacturing to more and more complex productions, as well as of a higher average price (in particular for the traditional Made in Italy products) and in sectors with a higher technological content (mechanics and automotive above all).
In terms of dynamics, in a stable global framework, the values of Asian countries stand out, characterized by strong increases in the complexity ranking but with very different levels between Japan, Singapore and Korea, on the one hand, and China and Hong Kong on the other, which reflect the profound differences within the Asian area in terms of productive specializations.